HR tech market size, the market map and what it means for the people selling into it
Four HR tech market size reports side by side, why they disagree by tens of billions, where funding went and how a vendor should use the numbers.
Brand strategy
Tech and SaaS
The Leapyn team
November 17, 2026
10 min read
In this post
toc
The head of marketing at a shift scheduling app has booked a glass study room at the public library, because the office is loud and the investor update goes out at the end of the month. Her CEO wants one slide on HR tech market size, and three printed reports are fanned across the table.
Each report has a different number circled in red. One values the market at $38.7 billion in 2025, one at $47.78 billion in 2024 and one at $61.2 billion in 2023.
All three firms publish methodology pages, and the gap between their numbers is bigger than the revenue of almost every company they list. Before that slide goes anywhere, it helps to know what each figure counts and what it means for a company selling into HR.
What is the HR tech market size?
Published estimates put the global HR technology market between about $38.7 billion and $61.2 billion for recent years, depending on the firm and what it counts. IMARC Group values 2025 at $38.7 billion and forecasts $72.5 billion by 2034. Every forecast we read expects growth of roughly 7% to 9% a year.
For a vendor, the honest use of any of these numbers is one sentence of context on a slide. The rest of this page is about the numbers that move a marketing plan.
Four reports, four different markets
These are the figures each firm publishes on its free report page, with the date the page was last updated. The full reports sit behind a paywall, so the methodology details are partly hidden.
Report and last update
Market size
Forecast
Annual growth
Worth knowing
IMARC Group, global HR technology market, October 2026
$38.7 billion in 2025
$72.5 billion by 2034
7.01%, 2026 to 2034
Gives North America 59.9% of the 2025 market
Market Research Future, HR technology market, September 2026
$47.78 billion in 2024
$115.82 billion by 2035
8.38%, 2025 to 2035
Its own summary section quotes a different set of figures
Kings Research, human resource technology market, February 2026
$61.2 billion in 2023
$122.3 billion by 2031
9.09%, 2024 to 2031
Gives North America 36.84% of the 2023 market
IMARC Group, United States HR tech market, February 2026
For the United States HR tech market alone, the IMARC United States HR tech report gives the $9.2 billion figure for 2025. People searching for the HR software market size or the HCM market size mostly land on these same pages, since the firms fold HCM suites and standalone HR software into one total.
Why do HR technology market estimates disagree?
Every firm defines the market its own way, and the free pages only hint at the rules. These are the differences that explain most of the spread.
What counts as HR technology. Some totals include outsourced payroll and services, and IMARC puts 88.6% of its market in outsourced delivery.
Base year. The reports start from 2023, 2024 and 2025, so a fast-growing market looks bigger in whichever report is newest.
Regions. IMARC gives North America 59.9% of the market and Kings gives it 36.84%, which is a different market wearing the same name.
Segments. IMARC's largest application is talent management at 24.0%, while Kings reports recruitment and talent acquisition at 30.96%, and the two firms draw those boxes differently.
Even a single firm can disagree with itself. IMARC's global report gives North America 59.9% of $38.7 billion, roughly $23 billion by our arithmetic, while its US report sizes the United States at $9.2 billion, which would leave Canada with a remarkable HR software habit.
The two reports were updated eight months apart and likely use different scopes, which is the whole point. Pick one source for your HR tech market size, cite it by name and year, and use the same one every time the number appears.
Trade You.
Your email for great content delivered to your inbox. Regularly. Unless we forget. Or get busy. But we'll try.
Thank you! Your submission has been received!
Oops! Something went wrong while submitting the form.
What are the categories of HR technology?
The Sapient Insights Group 2026-2027 HR Systems Survey covers 23 HR technology categories, which is the most detailed public count we found. The market research firms use five or six broad segments, and even the biggest slice depends on who cuts the pie.
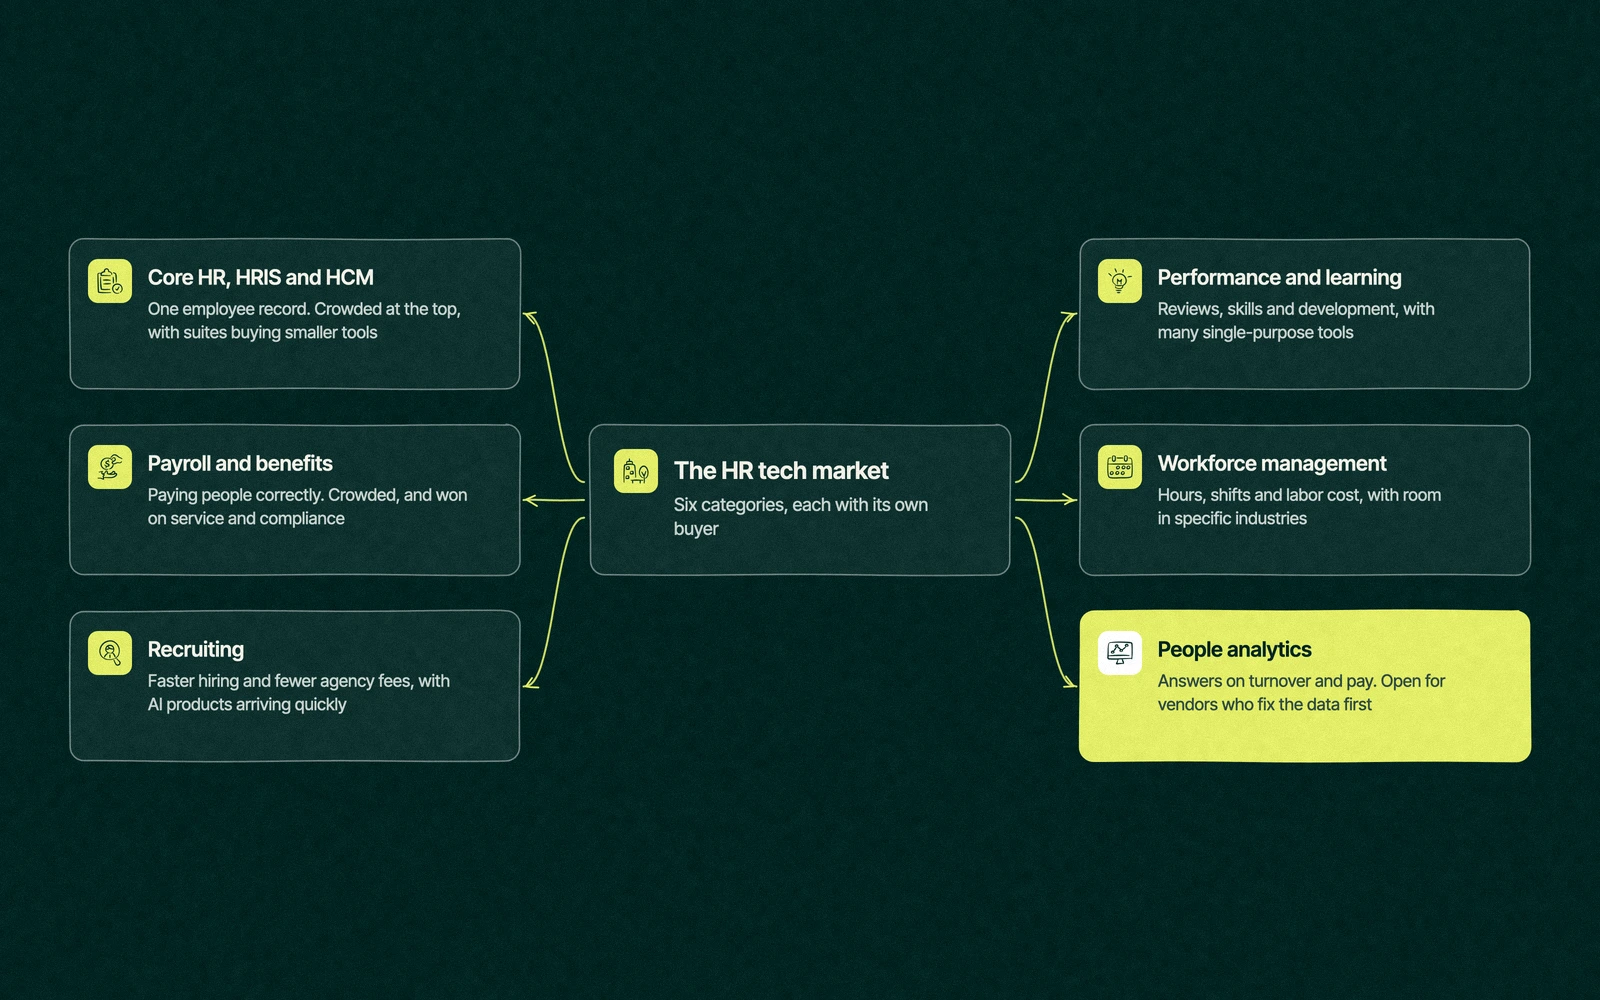
For marketing, a simpler HR tech market map does more work. Group the categories by what buyers pay for and who signs, then find your box.
Category
What buyers pay for
Who usually signs
How crowded (our read)
Core HR, HRIS and HCM suites
One employee record, the org chart and compliance
The head of HR, with finance and IT
Crowded at the top, with large suites buying smaller tools
Payroll and benefits administration
Paying people correctly in every state and country
Finance or the controller, with HR
Crowded, and won on service and compliance
Recruiting and talent acquisition
Faster hiring and fewer agency fees
The head of talent
Crowded, with AI products arriving quickly
Performance, learning and talent management
Reviews, skills and development
HR business partners and learning leads
Busy, with many single-purpose tools
Workforce management, time and scheduling
Hours, shifts and labor cost for hourly staff
Operations with payroll
Busy, with room in specific industries
People analytics and employee listening
Answers on turnover, pay and headcount cost
The head of HR and finance
Open for vendors who fix the data first
The crowding column is our judgment from working in the category, so test it against your own win and loss notes. For the companies inside each box, our guide to HR tech companies names the main players by category.
Crowded boxes are won on comparison pages, review sites and paid search, because buyers already know the category and are choosing between names. Open boxes are won on education, since the buyer may not know the category has a name yet, and the first vendor to explain it well tends to own the search results for it.
Plenty of HR software companies sit in a crowded box and market themselves as if they were in an open one. The mismatch shows up as a homepage explaining a category to buyers who have shopped in it every year since they started in HR.
Where did HR tech funding go?
Crunchbase News reported in September 2025 that HR software startups had raised $1.9 billion globally that year by mid-September, just under the $2 billion raised in all of 2024. In the US, 2025 funding had already passed the full 2024 total, $1.2 billion against $1.1 billion.
The deal count tells the sharper story. Crunchbase counted 236 global deals in 2025 to that point against 419 in 2024, so similar money was going into far fewer companies.
The 2021 peak of $10.5 billion now reads like a yearbook photo, accurate at the time and a little embarrassing for everyone in it. HR tech investment today goes to companies with traction, which means your best-funded rivals are also the ones with the biggest ad budgets next quarter.
That shapes HR tech funding conversations too. Investors ask for a customer count and a sales cycle long before they ask about the size of the HR technology market, and our post on HR technology trends covers where the AI money is showing up in products.
Funding also changes who you compete with for attention. A rival that just raised tends to buy conference sponsorships, analyst briefings and ads on your brand name, so check your own branded search results in the month after any big round in your box.
The slide that survived the investor update
Back in the library, suppose the marketing lead drops two of the three printouts. She keeps IMARC's 2025 figure because its date is clear, puts the report name and year in a footnote and gives it one line on the slide.
She also writes down where the other two numbers came from. When an investor asks why another deck said $61.2 billion, the answer now takes one sentence instead of a follow-up email.
The rest of the slide goes to the market her app can win this year. That's companies with large hourly workforces in the states where its payroll integrations already work, counted from public business data and named customers in the same segments.
Investors have seen the big global number before. They have seen it from every company in the category, sometimes on the same afternoon, and the question they ask comes back to the segment, the integrations and the sales cycle.
The slide that holds up shows a company that knows which buyers it can reach. The global total is the backdrop.
What the number changes in your marketing plan
An HR tech market size is context for a plan, and these are the places it should change one.
Use the top-line figure once, with the source and year, and never as a share you expect to win.
Size your own market from your buyer, such as companies of your target size in the states and systems you serve.
Find your box on the map and decide how you'll stand apart in it, which our guide to positioning an HR tech product walks through.
Budget for the crowd. US advertisers pay $189.01 a click for "hr software demo" (Semrush, November 2026), and crowded boxes cost more to buy into, as our HR tech marketing budget guide explains.
Read funding news as competitive research, since a rival's new round usually shows up in your search results a quarter later.
If the plan itself is the gap, our HR tech go to market post lays out what to do at each stage.
From market slide to marketing plan
We help HR software companies turn the market map into positioning and a plan they can run. Our positioning work picks the box you can own, and our marketing strategy service turns it into channels and a budget.
A positioning sprint is priced as a project fee agreed in writing before work starts, and the monthly and retainer options sit beside it on our pricing page. Work ships weekly, so the plan reaches your sales team while the investor update is still fresh.
Send us the market slide from your last pitch deck. We'll rebuild it around the buyers you can win this year.Book a free 30-minute strategy session and we'll size your segment with you on the call.
“
The first call felt like talking to someone who already understood our business. We didn’t have to explain the basics. They showed up with questions that mattered.
James L.
Director of Growth, HR tech
Client
FAQ
Frequently asked questions
What is the HR tech market size?
+
Estimates for recent years range from about $38.7 billion to $61.2 billion globally. IMARC Group puts 2025 at $38.7 billion, Market Research Future puts 2024 at $47.78 billion and Kings Research puts 2023 at $61.2 billion. The gap comes from what each firm counts, so cite one report by name and year instead of mixing figures from several.
What are the categories of HR technology?
+
Sapient Insights Group's 2026-2027 HR Systems Survey covers 23 categories, which most people group into core HR and HCM suites, payroll and benefits, recruiting, talent management and learning, workforce management and people analytics. Market research firms use fewer, broader segments. IMARC, for example, splits its market into talent management, payroll, performance, workforce management, recruitment and other applications.
Is the HR tech market growing?
+
Every major forecast we reviewed expects growth. IMARC projects 7.01% a year from 2026 to 2034, Market Research Future 8.38% from 2025 to 2035 and Kings Research 9.09% from 2024 to 2031. Venture funding tells a cooler story, with Crunchbase News counting far fewer HR software deals in 2025 than in 2024 for similar total dollars.
How much venture funding goes into HR tech?
+
Crunchbase News reported $1.9 billion in global HR software funding for 2025 as of mid-September, just under the $2 billion raised across 2024 and far below the $10.5 billion peak of 2021. The money went into fewer rounds, 236 deals against 419 the year before, which points to investors backing companies that already have traction.
How do you use a market map for marketing?
+
Find your box, then look at who else sits in it and what buyers there pay for. A crowded category needs sharper positioning and a bigger paid budget, while an open one needs education content first. Leapyn uses the map this way when planning positioning and channels for HR software companies, starting from the buyers a company can win this year.
Written by
The Leapyn team
Senior marketers who run strategy, creative and demand gen for B2B companies. We write about what’s working for our clients right now.